Deploying apps to Azure App Service is as easy as 1,2,3. But sometimes things don't go exactly as planned and you end up with a sad (and rather cryptic) 502, 503 or other 5xx error while starting up the app. These problems are quite hard to debug as the app has not started yet and hence it can't show any useful error message itself. The server then just surfaces a generic and hard to understand error page which is not very helpful. Luckily Azure provides just the tool to better understand what is happening. Enter Diagnostic logging.

Two types of diagnostics logs
There are two types of diagnostic logging available in Azure App Service
- Application Diagnostics - capture log information produced by the application, including logs created using
System.Diagnostics.Trace - Web Server Diagnostics - provide detailed error logging, failed request tracing and web server logs
Enabling diagnostics logging
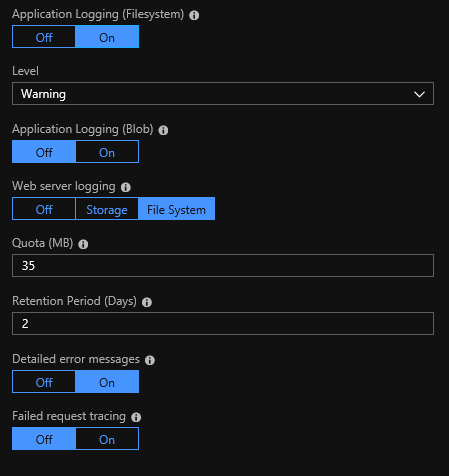
Diagnostic Logs can be easily enabled in the Azure Portal user interface. Open your Azure App Service and select Diagnostics logs in the Settings pane. In the Logs blade you have several toggles which allow you to enable specific features of diagnostic logging.

Using the two first Application Logging toggles you can choose to output to the file system or to Azure Storage Blobs. The output for both is the same so you can choose the location which is more appropriate for you. You can choose the level of log messages which are written to the log. Beware that File System logging for application turns off automatically after 12 hours. Web server logging enables the second type of diagnostic logging. Here you must again choose the target location, but you must select either Azure Storage or file system, the logging can't be output to both destinations at once. Finally to enable logging of Detailed error messages and Failed request tracing use the homonymous toggles below.
Accessing file system logs
To access the File System logs, check out the FTP info below the form. This is useful, but you can notice the missing password. To get this, you must go to Overview page for your App Service and then click Get publish profile in the top toolbar.

This downloads a .PublishSettings file which is actually a XML file. Here search for <PublishProfile> with attribute publishMethod="FTP". This same profile will contain userPWD which is the password you can use to connect to your FTP. You can use any FTP client like FileZilla. The logs are stored in a structured manner in LogFiles folder. Each type of logs has its own folder. Failed Requests are in folder starting with W3SVC, Web Server logs are in folder http/RawLogs . Finally, there are also special logs created by internal deployment processes used by App Service and Git in folder Git.
Accessing Storage Blob logs
The way logs are stored in Azure Storage is analogous to file system, but for convenient access I recommend downloading Azure Storage Explorer, which presents the Azure Storage contents in file browsing-like manner and is easy to use.
Using Log stream
Once you enable Application logs or Web server logs, you get yet another additional way to access your logs almost in real-time. In the Settings pane of your application you will find Log stream menu item right below Diagnostic logs. You will be presented with a console-like user interface where you can switch between Application and Web server logs and will see the incoming logs immediately as they occur. This is especially useful when debugging startup and request issues.

Summary
Diagnostics logs are an extremely useful feature of Azure App Service. It provides a range of tools and different log types to give you just the information you need to diagnose and fix any issue. From my experience, it is quite usual you will need to use multiple log types at once to zero in on the source of your problem. For example for problems with starting up an ASP.NET Core application, the Log stream might give you a general idea when the startup crashes but the log files can give you more detailed information on what actually happened.