It is quite common to debug both your app and API project simultaneously in Visual Studio. Unfortunately, until recently this was quite cumbersome — selecting multiple startup projects was possible, but this configuration was a one-off thing with no way to persist the setup. In addition, when you accidentally or deliberately selected a different startup project, your carefully crafter multi-project setup was gone forever!
Luckily Visual Studio 2022 17.10 and newer bring a game-changing feature that will make this significantly easier — Multi-project Launch Profiles. Not only you will be able to specify a arbitrary number of such multi-project setups, but you will also be able to persist them and shared them with other developers in your team. Let's it out together 🚀 !
Enabling the feature
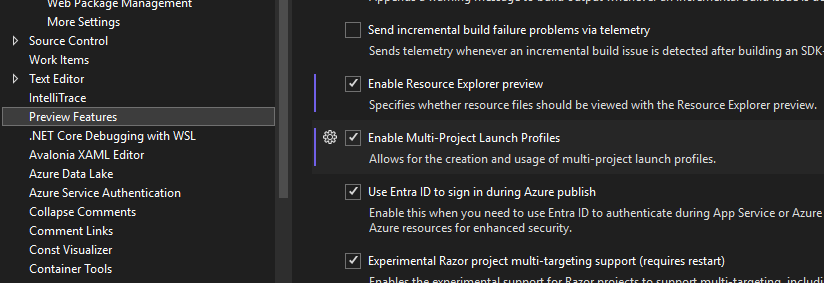
As of March 2024 this feature is still in preview so it needs to be enabled manually in Visual Studio. Go to Tools - Options... and look for Preview Features in the left pane. Then find the Enable Multi-Project Launch Profiles checkbox in the list and tick it ✅ . Restart Visual Studio for the change to take effect.
Creating a Multi-Project Launch Profile
For demonstration purposes I have created a blank Uno Platform app with a Server project included in the wizard. This covers the common scenario of having a client application with a dedicated first-party API.
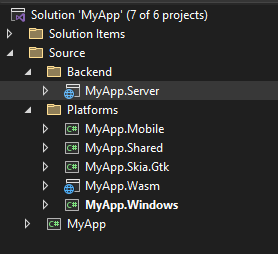
Right-click the solution node in Solution Explorer and select Configure Startup Projects... in the context menu.

In the dialog window select the Multiple startup projects section and we can start creating your first launch profile! In the right side you will find a list of the projects in your solution along with their targets. For each project we can decide if it will be part of the launch setup and even decide whether it should start with or without debugging. Here is what I came up with to launch the Server project and the Windows app:
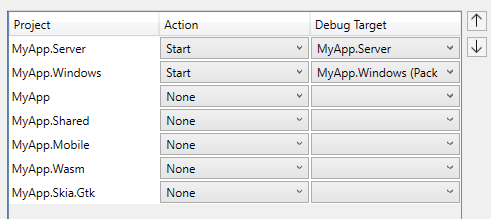
Note the order of projects is important, as Visual Studio will launch them in the order specified. Use the arrow buttons on the right-hand side to reorder as needed.
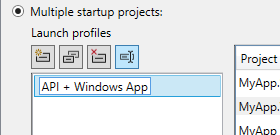
To make it easier to recognize, we can also name our profile using the button in the toolbar:
Finally, we can decide whether the launch profile should be shared by ticking the Share profile checkbox:
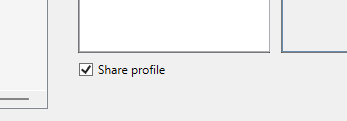
This will generate a .slnLaunch file next to our solution. This file can be checked into our source control, which means we and our teammates can use the same launch profile again on any machine!
Click Ok and our Multi-Project Launch Profile is ready to be used!
Let's run it ▶️ !
Once the profile is created, it will show up next to the Start debugging button in the toolbar as a available startup item:
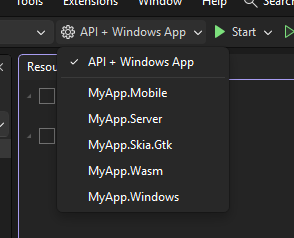
Clicking Start or pressing F5 will start our selected projects and we can start debugging!